Getting Started with Alicorn
Alicorn is the web interface for visualizing and analyzing Unicornscan data. It provides an intuitive dashboard for exploring scan results, tracking hosts over time, comparing scans to detect changes, and understanding your network topology.
Prerequisites: This guide assumes you have Unicornscan installed and have already run scans with the
-epgsqldbmodule to populate the database. If you haven't done this yet, see Getting Started with Unicornscan first.
1. Quick Start
1.1 Starting Alicorn
If you installed via package, Alicorn is managed through the unicornscan-alicorn
command:
sudo unicornscan-alicorn start
This starts both the PostgREST backend and the Alicorn web server. By default, Alicorn is available at:
http://localhost:31337
1.2 Navigation Overview
Alicorn's sidebar provides access to all major features:
| Section | Purpose |
|---|---|
| Dashboard | Overview stats, charts, and recent activity |
| Scans | Browse, filter, compare, and export scan data |
| Hosts | Aggregated host inventory across all scans |
| Topology | Network graph visualization |
| Statistics | Advanced analytics, heatmaps, and GeoIP data |
| Settings | Database and GeoIP configuration |
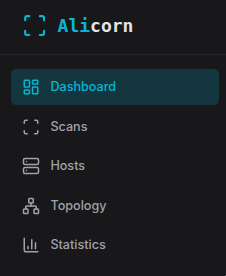 Click to enlargeAlicorn sidebar navigation
2. Dashboard
The Dashboard provides a high-level overview of your scan data.
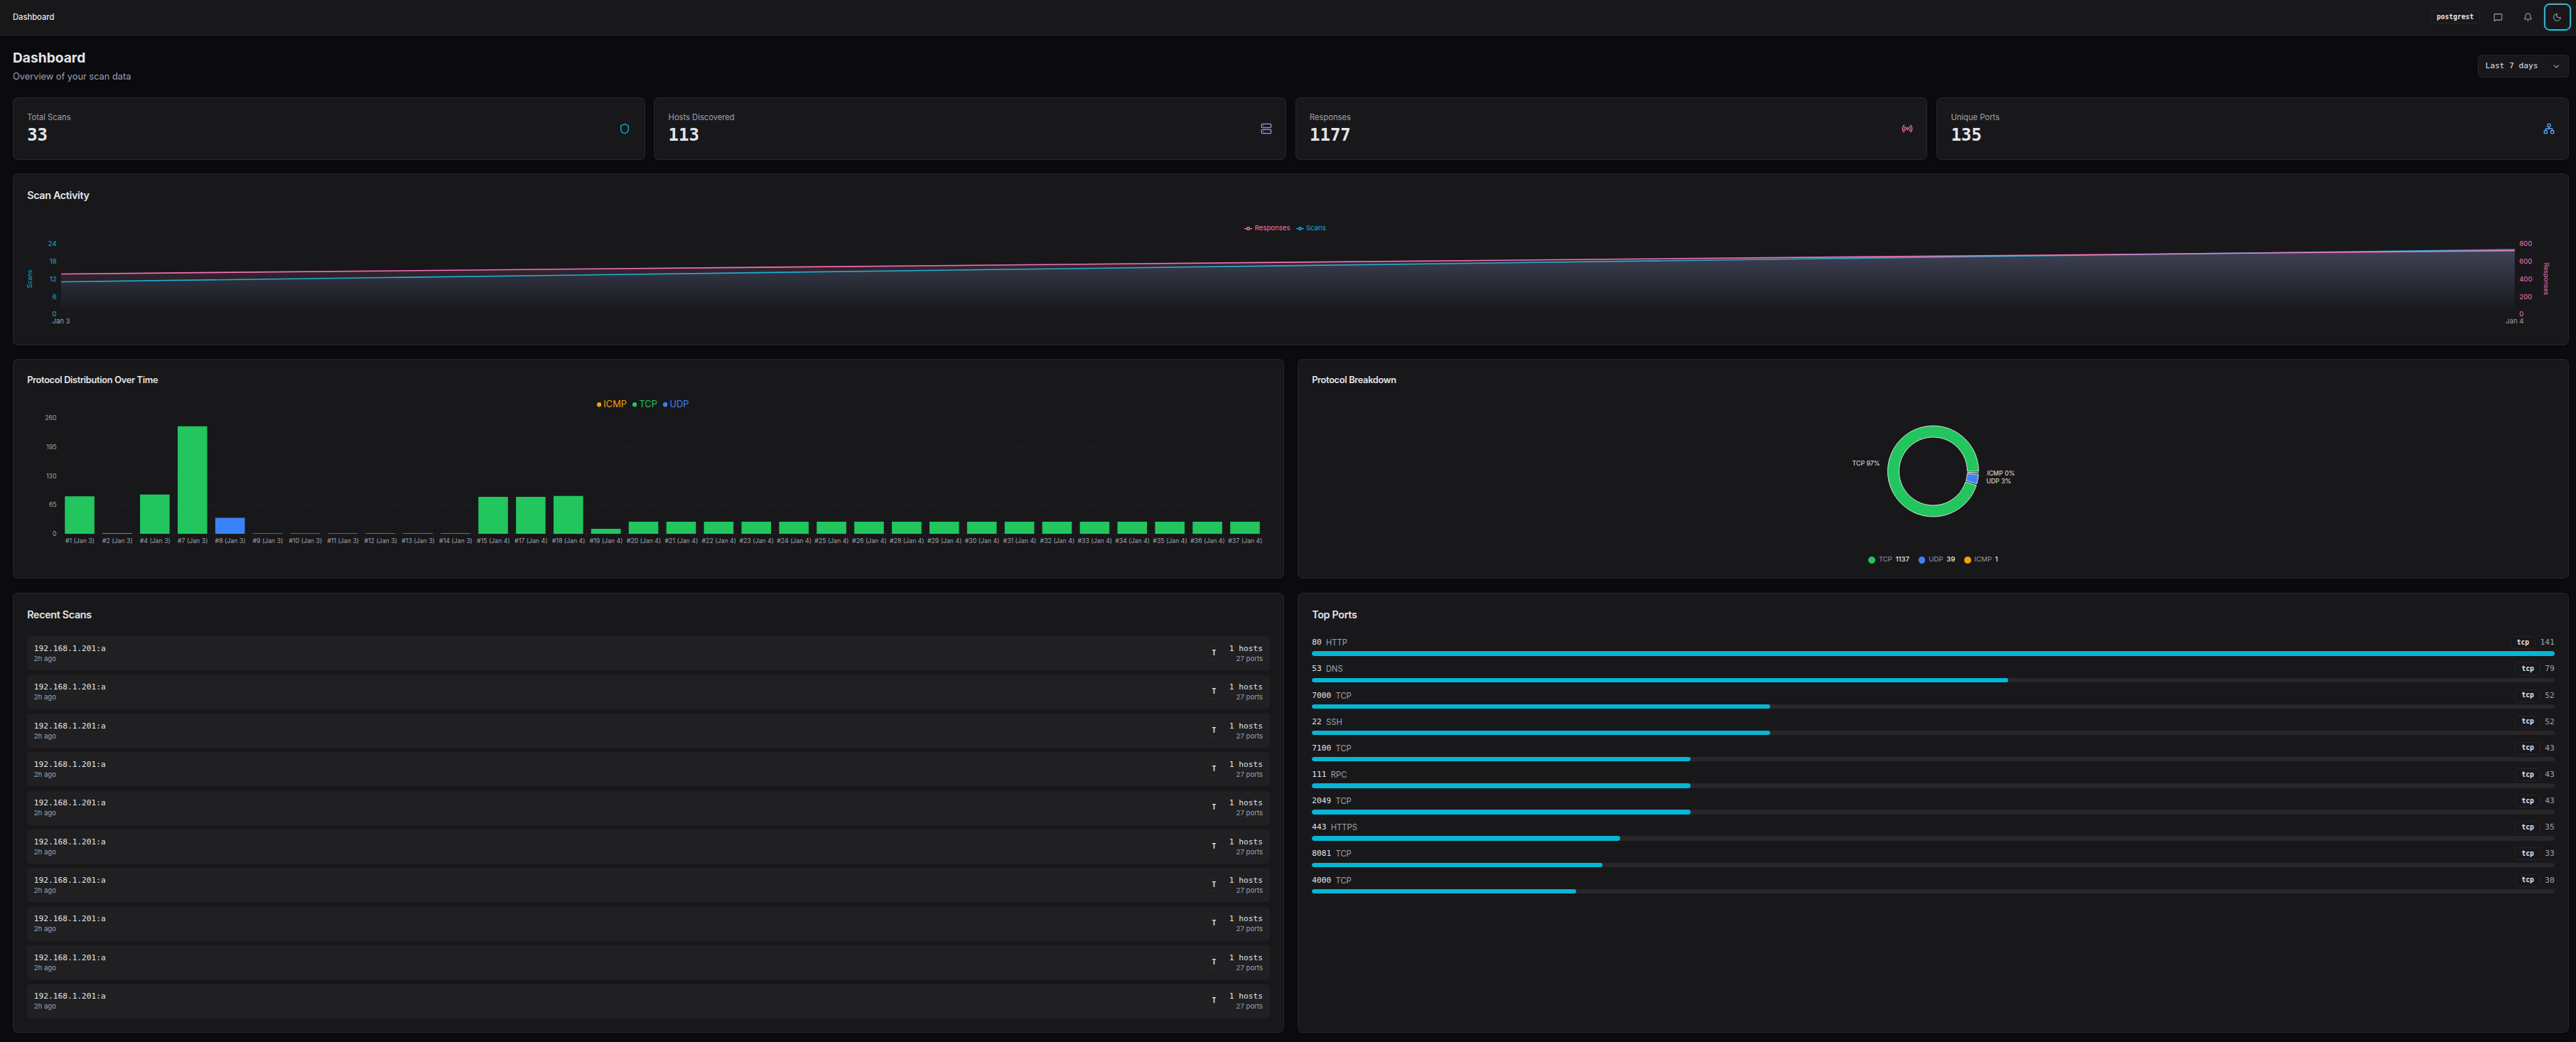 Click to enlargeDashboard overview
2.1 Time Range Selector
In the top-right corner, the time range selector filters all dashboard data:
- ▸24h - Last 24 hours
- ▸7d - Last 7 days (default)
- ▸30d - Last 30 days
- ▸90d - Last 90 days
- ▸All - All time
2.2 Stats Overview
The stats cards at the top show key metrics for the selected time range:
- ▸Total Scans - Number of scans performed
- ▸Hosts Discovered - Distinct IP addresses discovered
- ▸Responses - Total responses received across all scans
- ▸Unique Ports - Distinct port numbers observed
2.3 Scan Timeline
The timeline chart visualizes scan activity over time, showing when scans were performed and how many results each produced.
2.4 Protocol Distribution
Two complementary views of protocol data:
- ▸Bar chart - Protocol distribution over time
- ▸Pie chart - Overall protocol breakdown
2.5 Recent Scans & Top Ports
The bottom section shows:
- ▸Recent Scans - Quick access to your latest scans
- ▸Top Ports - Most frequently discovered ports across all scans
3. Scans
The Scans page is your central hub for managing scan data.
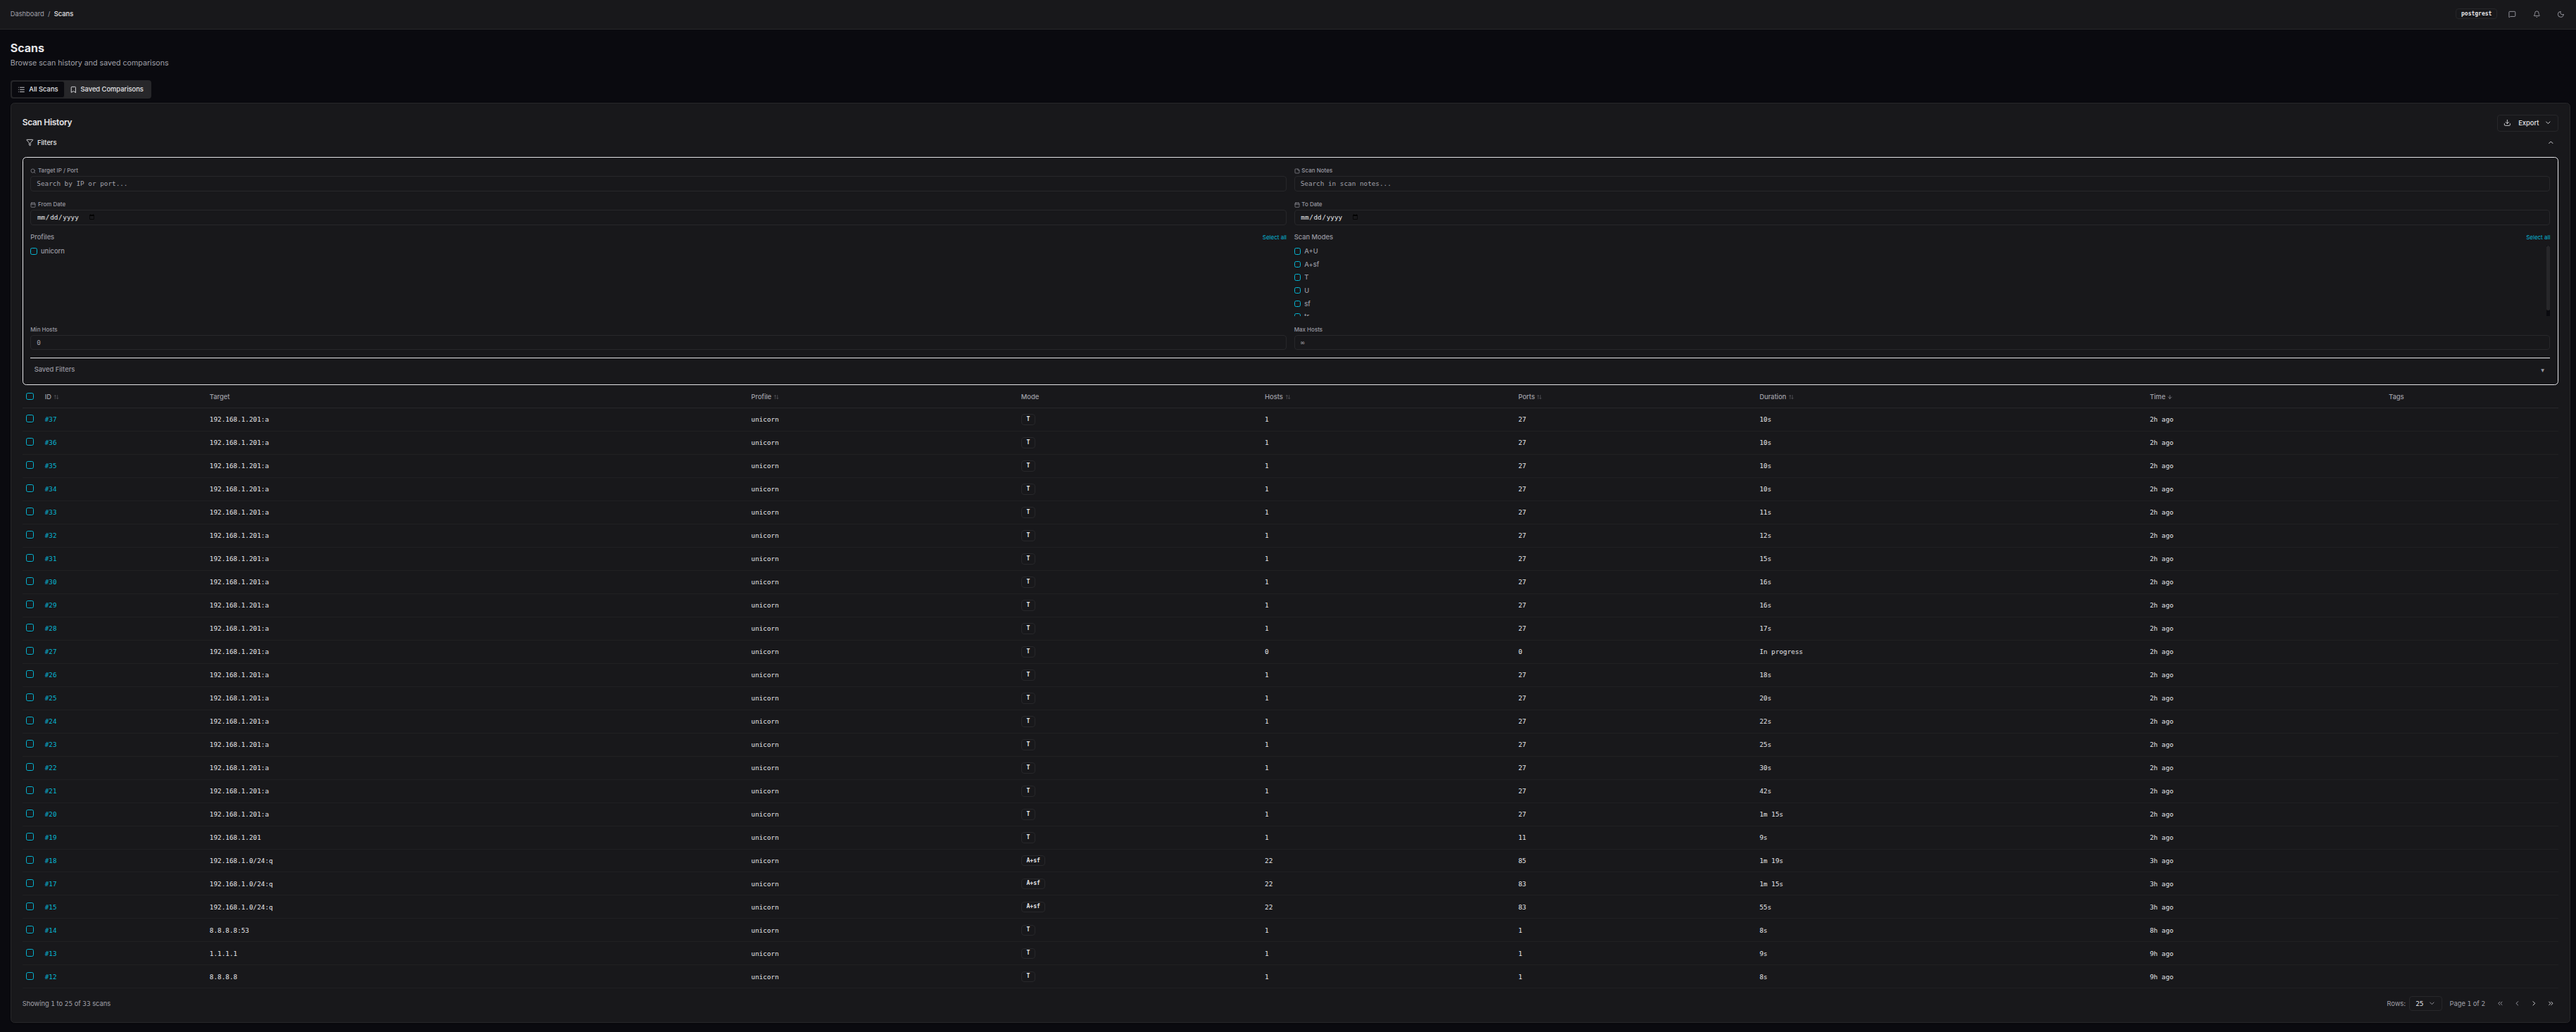 Click to enlargeScans list page
3.1 Browsing Scan History
The scan table displays all scans with key information:
- ▸Scan ID - Unique identifier (click to view details)
- ▸Target - The target specification used
- ▸Mode - Scan mode (TCP SYN, UDP, ARP, etc.)
- ▸Ports Found - Number of open ports discovered
- ▸Timestamp - When the scan was performed
3.2 Filtering and Sorting
Use the filter bar to narrow down results:
- ▸Search - Filter by target string
- ▸Mode - Filter by scan mode
- ▸Date range - Filter by time period
Click any column header to sort by that field. Click again to reverse the order.
3.3 Viewing Scan Details
Click a scan ID to view its detail page:
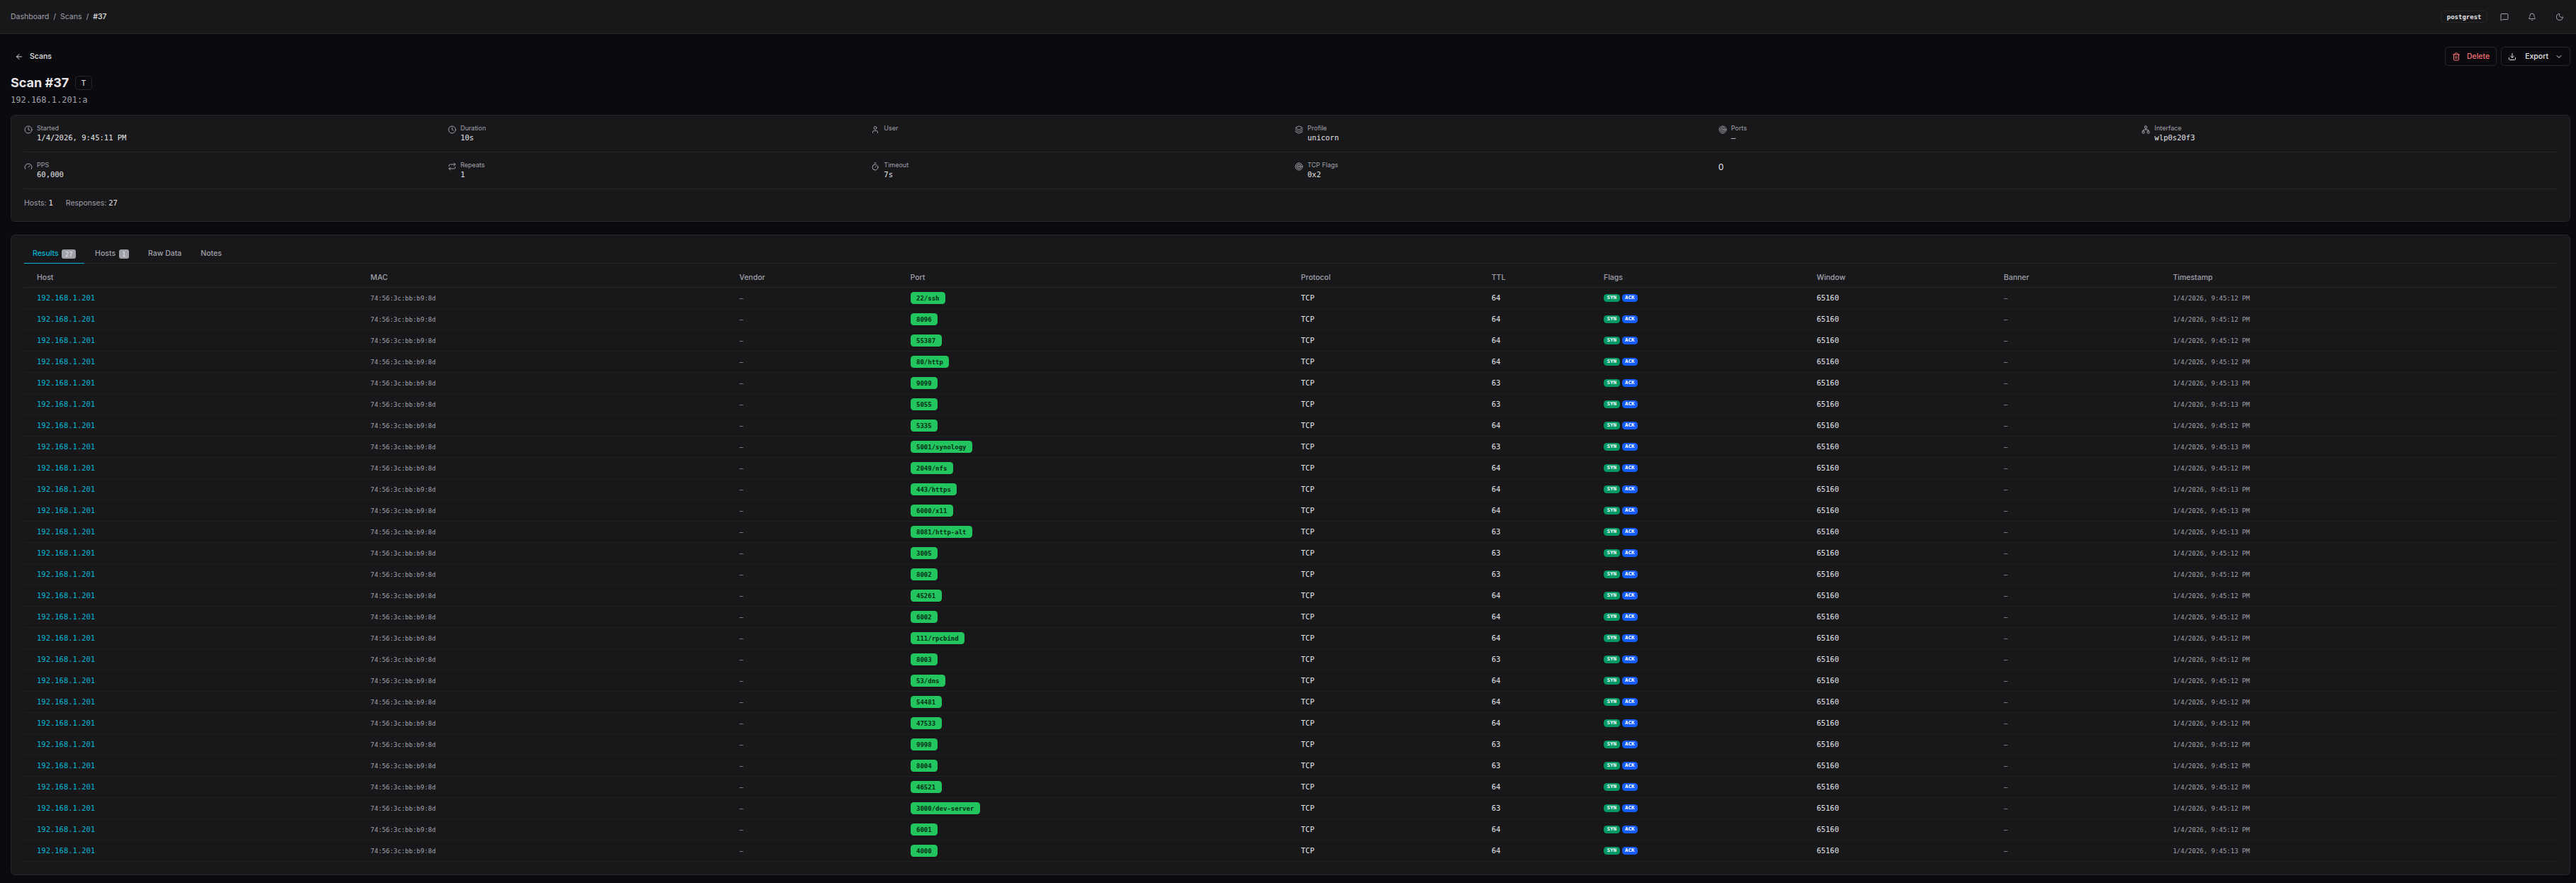 Click to enlargeScan detail page
The detail page includes:
- ▸Results Tab - All discovered ports with service info, TTL, and TCP flags
- ▸Hosts Tab - Aggregated view by host
- ▸ARP Results - Layer 2 discovery results (if ARP mode was used)
- ▸Traceroute - Path data (if traceroute mode was used)
- ▸Raw Data - JSON export of all scan data
- ▸Notes - Add annotations to the scan
3.4 Exporting Scan Data
Use the export dropdown to download scan data:
- ▸CSV - Spreadsheet-compatible format
- ▸JSON - Machine-readable format
- ▸Markdown - Documentation-friendly format
For advanced export options, click "Export Options..." to customize what fields are included.
3.5 Bulk Operations
Select multiple scans using the checkboxes to:
- ▸Delete - Remove selected scans from the database
- ▸Compare - Open the comparison view (see Section 4)
4. Comparing Scans
The scan comparison feature is one of Alicorn's most powerful capabilities. It allows you to visualize differences between multiple scans of the same target, making it trivial to spot changes that would otherwise require complex regex and manual comparison.
4.1 Why Compare Scans?
During security assessments and network monitoring, you often scan the same targets multiple times:
- ▸Before and after patching - Verify that vulnerabilities were remediated
- ▸Periodic monitoring - Detect new services or unexpected changes
- ▸Incident response - Compare current state to a known-good baseline
- ▸Change validation - Confirm firewall rules are working as expected
In the past, spotting differences between scan-1 and scan-2 required complex regex patterns and manual inspection. Alicorn's comparison feature makes finding these deltas trivial.
4.2 Selecting Scans for Comparison
Step 1: Select your first scan
On the Scans page, click the checkbox next to a scan you want to compare:
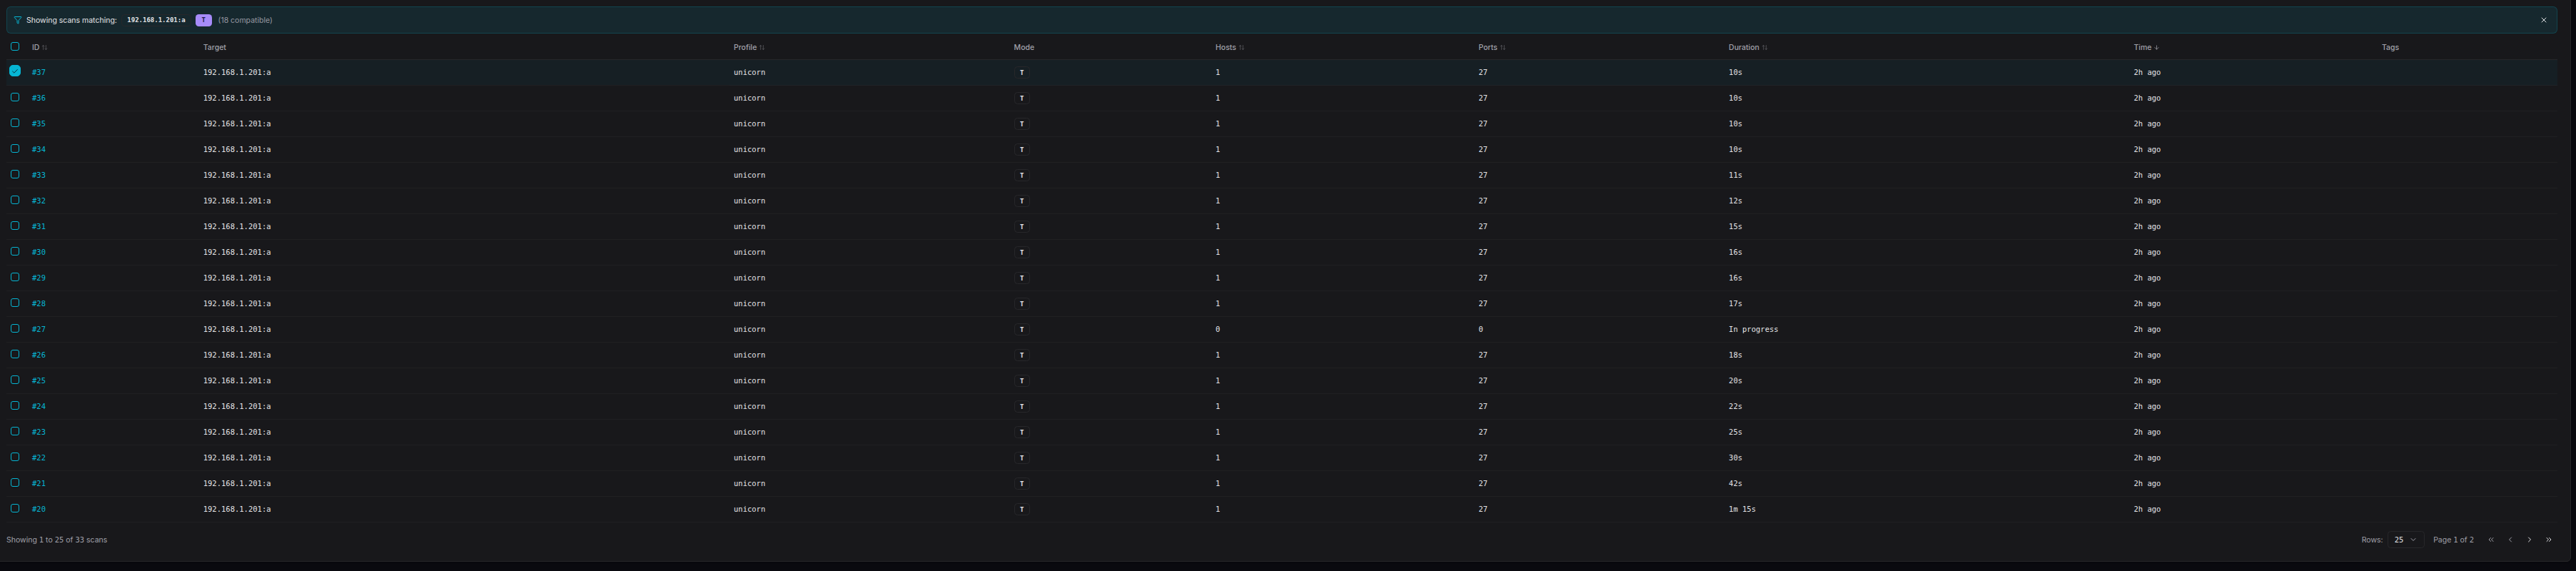 Click to enlargeFirst scan selected with checkbox
Step 2: Notice the compatibility filter
Once you select a scan, Alicorn automatically filters the list to show only compatible scans - those with the same target and mode. This ensures meaningful comparisons:
Step 3: Select additional scans
Select one or more additional scans to compare. You can compare 2 or more scans simultaneously.
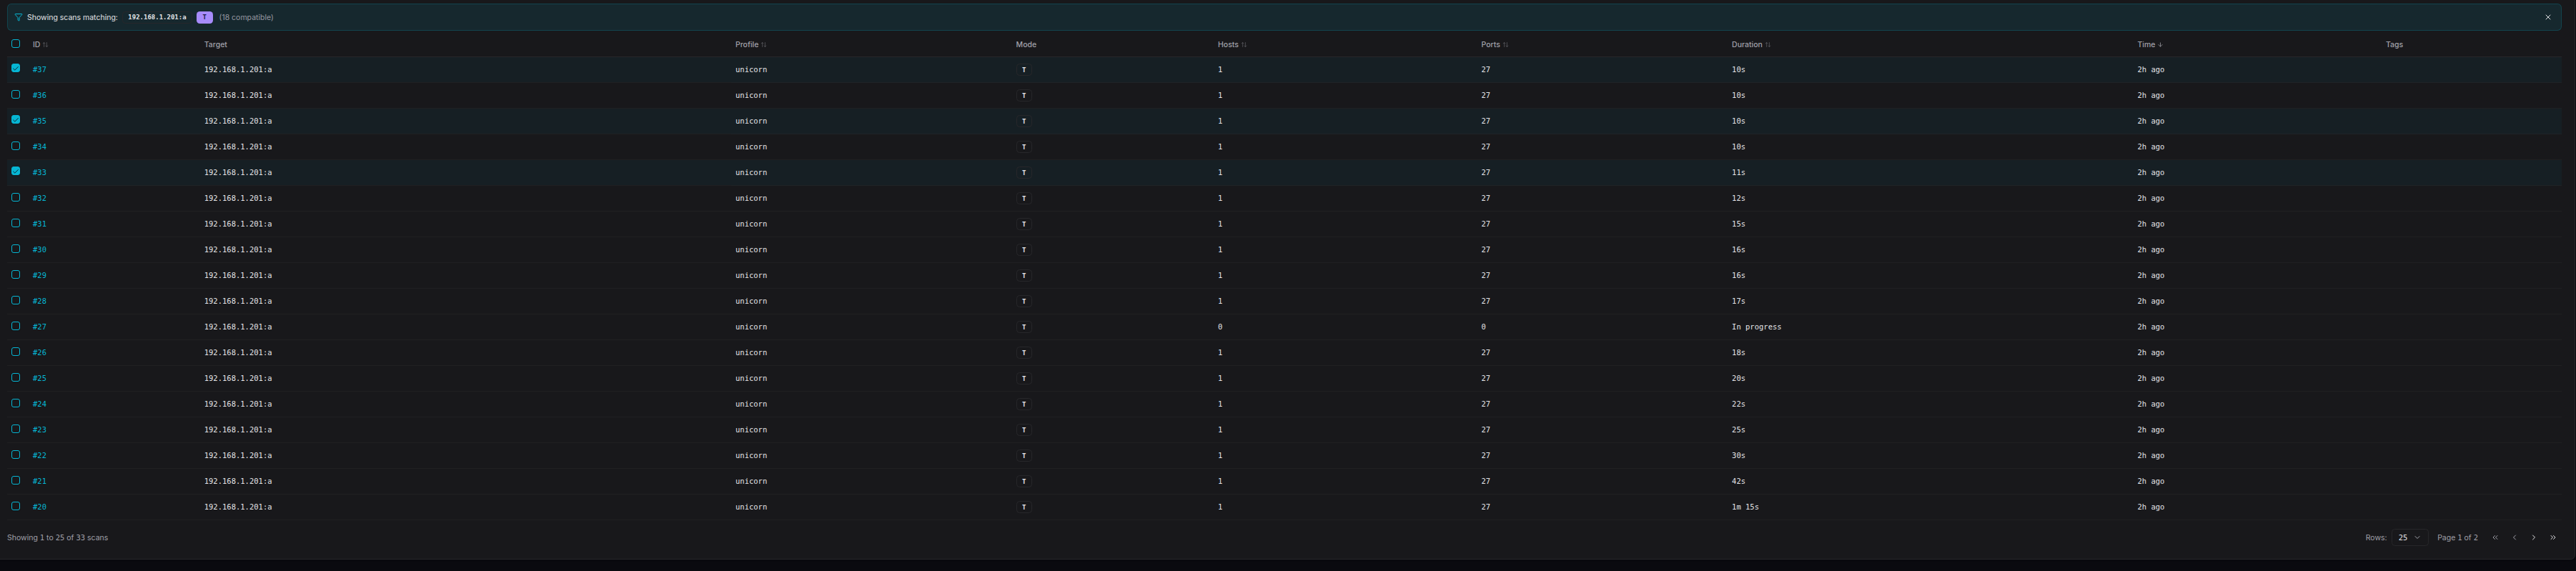 Click to enlargeMultiple scans selected for comparison
Step 4: Click Compare
A floating action bar appears at the bottom of the screen showing how many scans are selected. Click the Compare button:
4.3 The Comparison Dashboard
The comparison view offers four visualization modes, each designed for different analysis needs:
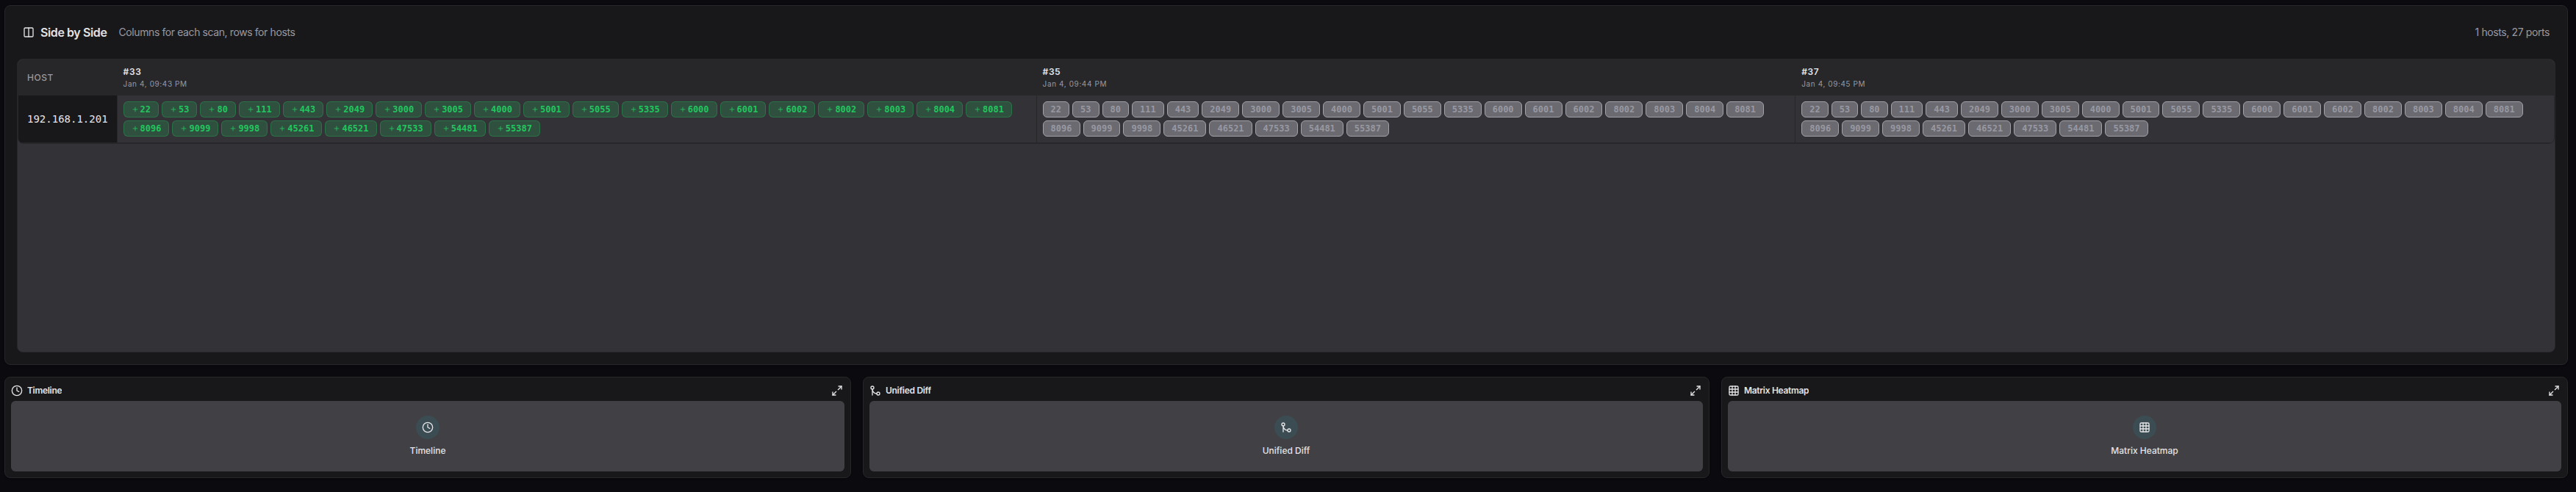 Click to enlargeComparison dashboard overview
Side-by-Side View
Displays each scan as a column with hosts as rows. Easy to visually scan across and spot differences:
 Click to enlargeSide-by-side comparison view
- ▸Green highlights indicate ports that appeared (new)
- ▸Red highlights indicate ports that disappeared (removed)
- ▸Neutral color indicates ports present in all scans
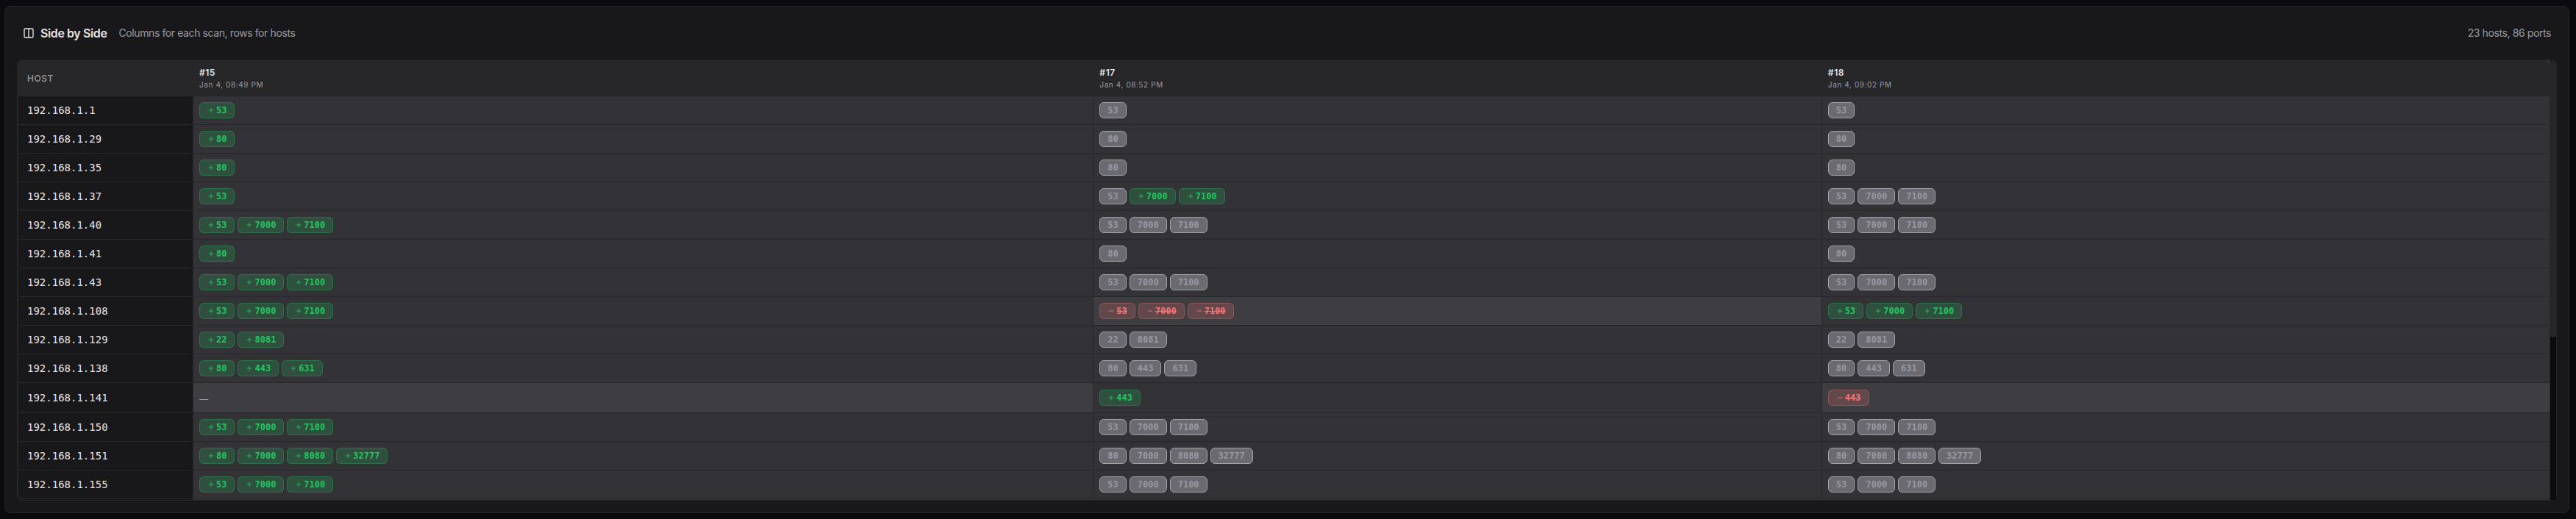
Timeline View
Shows changes chronologically, making it easy to understand when services appeared or disappeared:
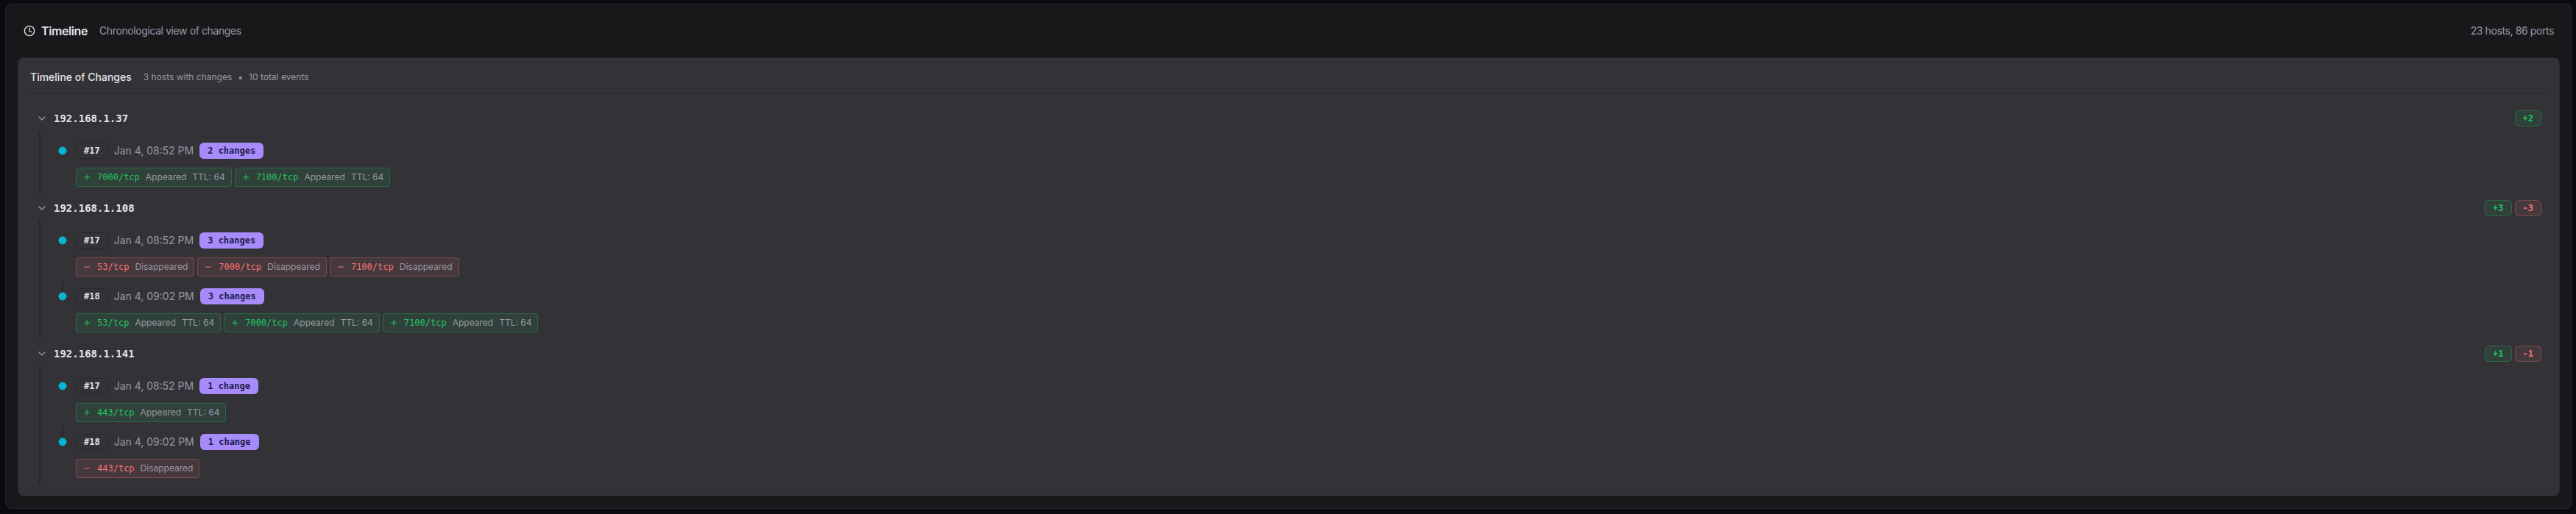 Click to enlargeTimeline comparison view
- ▸Each row represents a host
- ▸Time progresses left to right
- ▸Color coding shows port state changes at each scan
Unified Diff View
A merged view inspired by code diff tools, showing all changes in a single scrollable list:
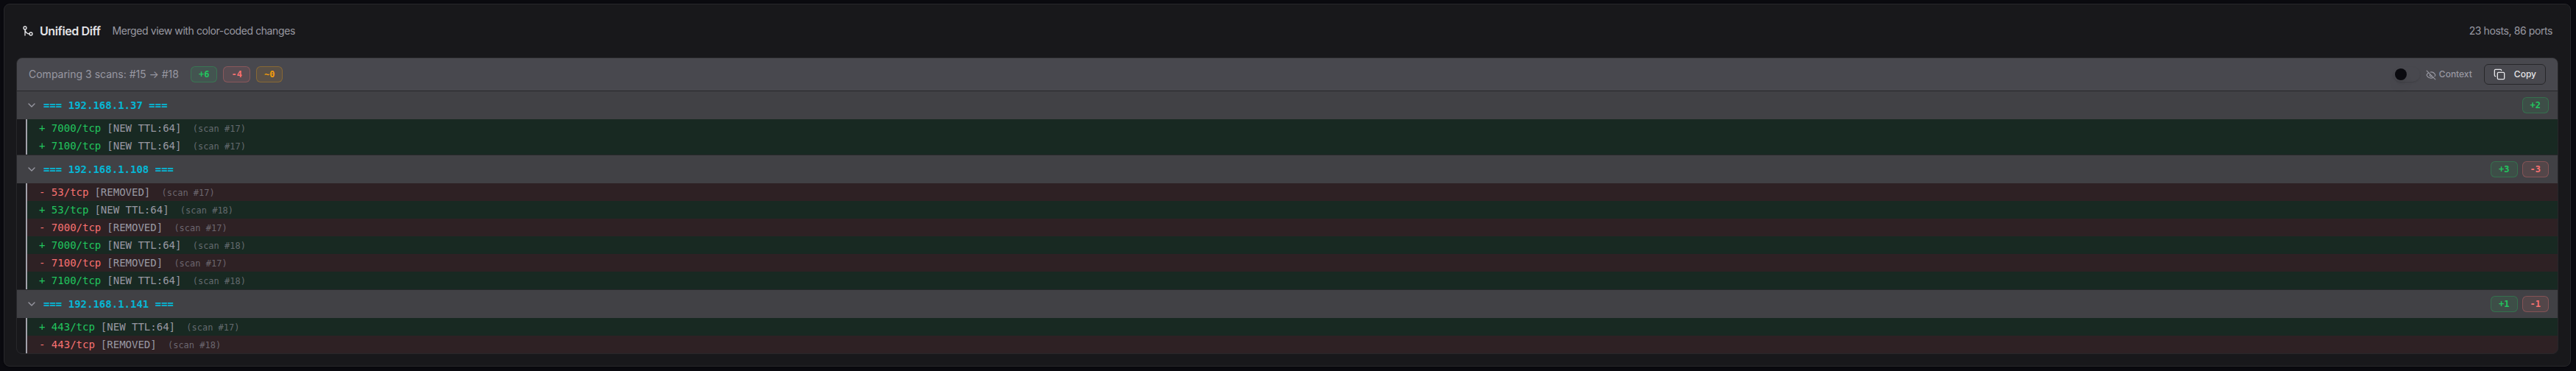 Click to enlargeUnified diff view
- ▸
+prefix and green background = added - ▸
-prefix and red background = removed - ▸Perfect for generating change reports
Matrix Heatmap View
A grid visualization showing port presence across all scans at a glance:
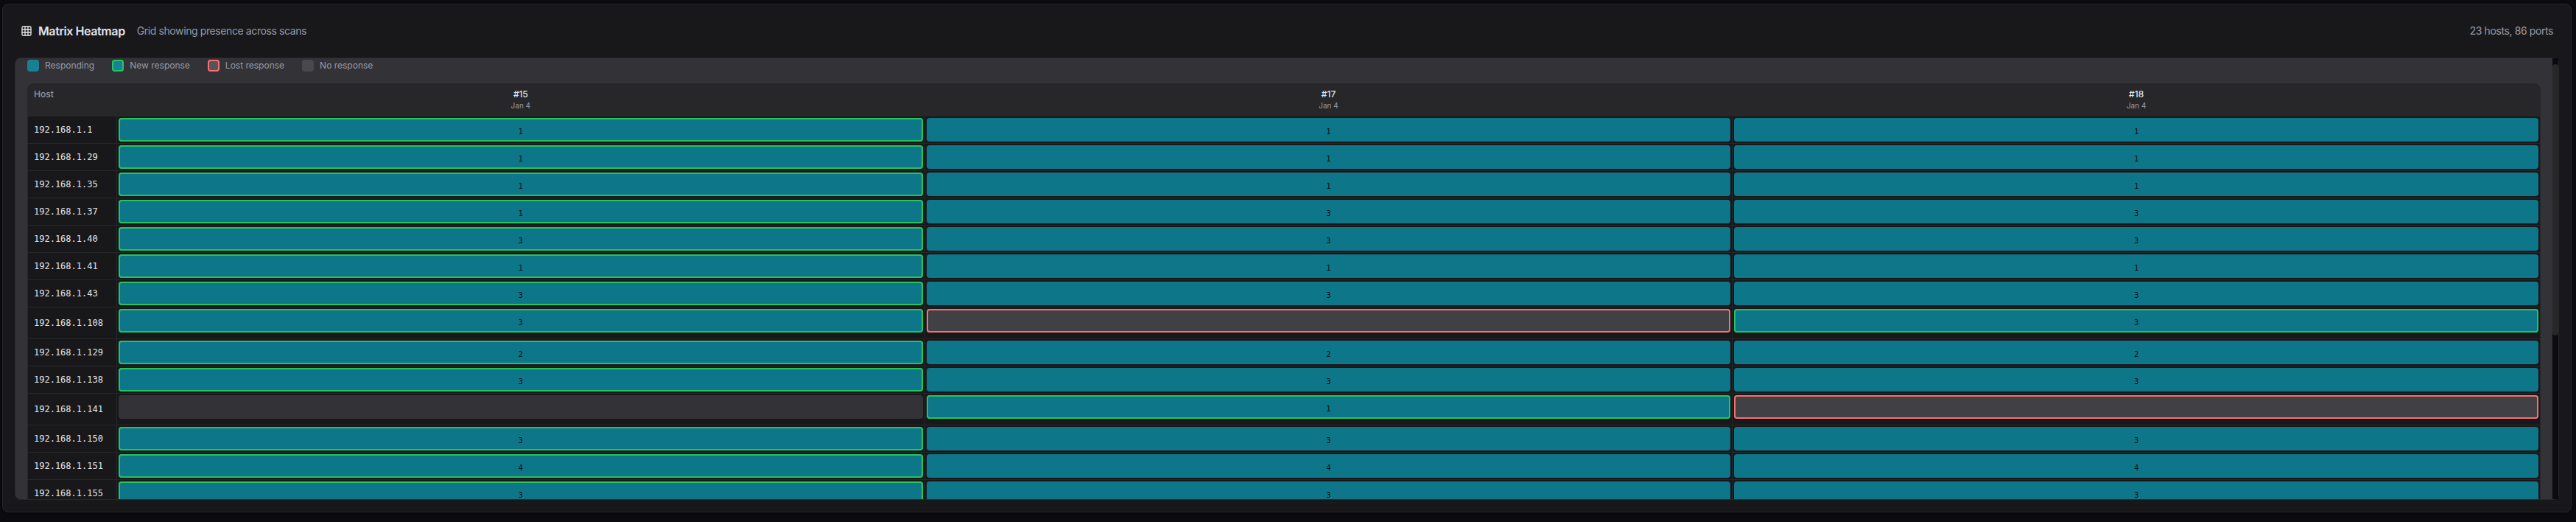 Click to enlargeMatrix heatmap view
- ▸Rows are hosts/ports
- ▸Columns are scans
- ▸Cell color intensity indicates presence
4.4 Comparison Walkthrough Example
Let's walk through a practical example: You scanned your network on Monday and again on Friday. Something changed and you want to find out what.
1. Go to Scans page and select Monday's scan
The list filters to show only compatible scans.
2. Select Friday's scan
You now have 2 scans selected.
3. Click Compare
The comparison dashboard opens with the Side-by-Side view.
4. Look for color-coded changes
Immediately you can see:
- ▸Host
192.168.1.50has a new port 8080 (green) - ▸Host
192.168.1.100no longer has port 22 open (red)
5. Switch to Unified Diff for a report
Click the Unified Diff thumbnail to see all changes in one list, perfect for including in a report.
4.5 Saving and Bookmarking Comparisons
For comparisons you want to revisit, you can save them with notes:
- ▸In the comparison header, type a note describing the comparison
- ▸The comparison is automatically saved after you stop typing
- ▸A bookmark icon indicates it's saved
Access saved comparisons from the Saved Comparisons tab on the Scans page:
 Click to enlargeSaved Comparisons tab
4.6 Exporting Comparison Results
Export your comparison analysis using the export dropdown:
- ▸CSV - Tabular data with change indicators
- ▸JSON - Full comparison data structure
- ▸Markdown - Ready for documentation or reports
5. Hosts
The Hosts page provides an aggregated view of all discovered hosts across all scans.
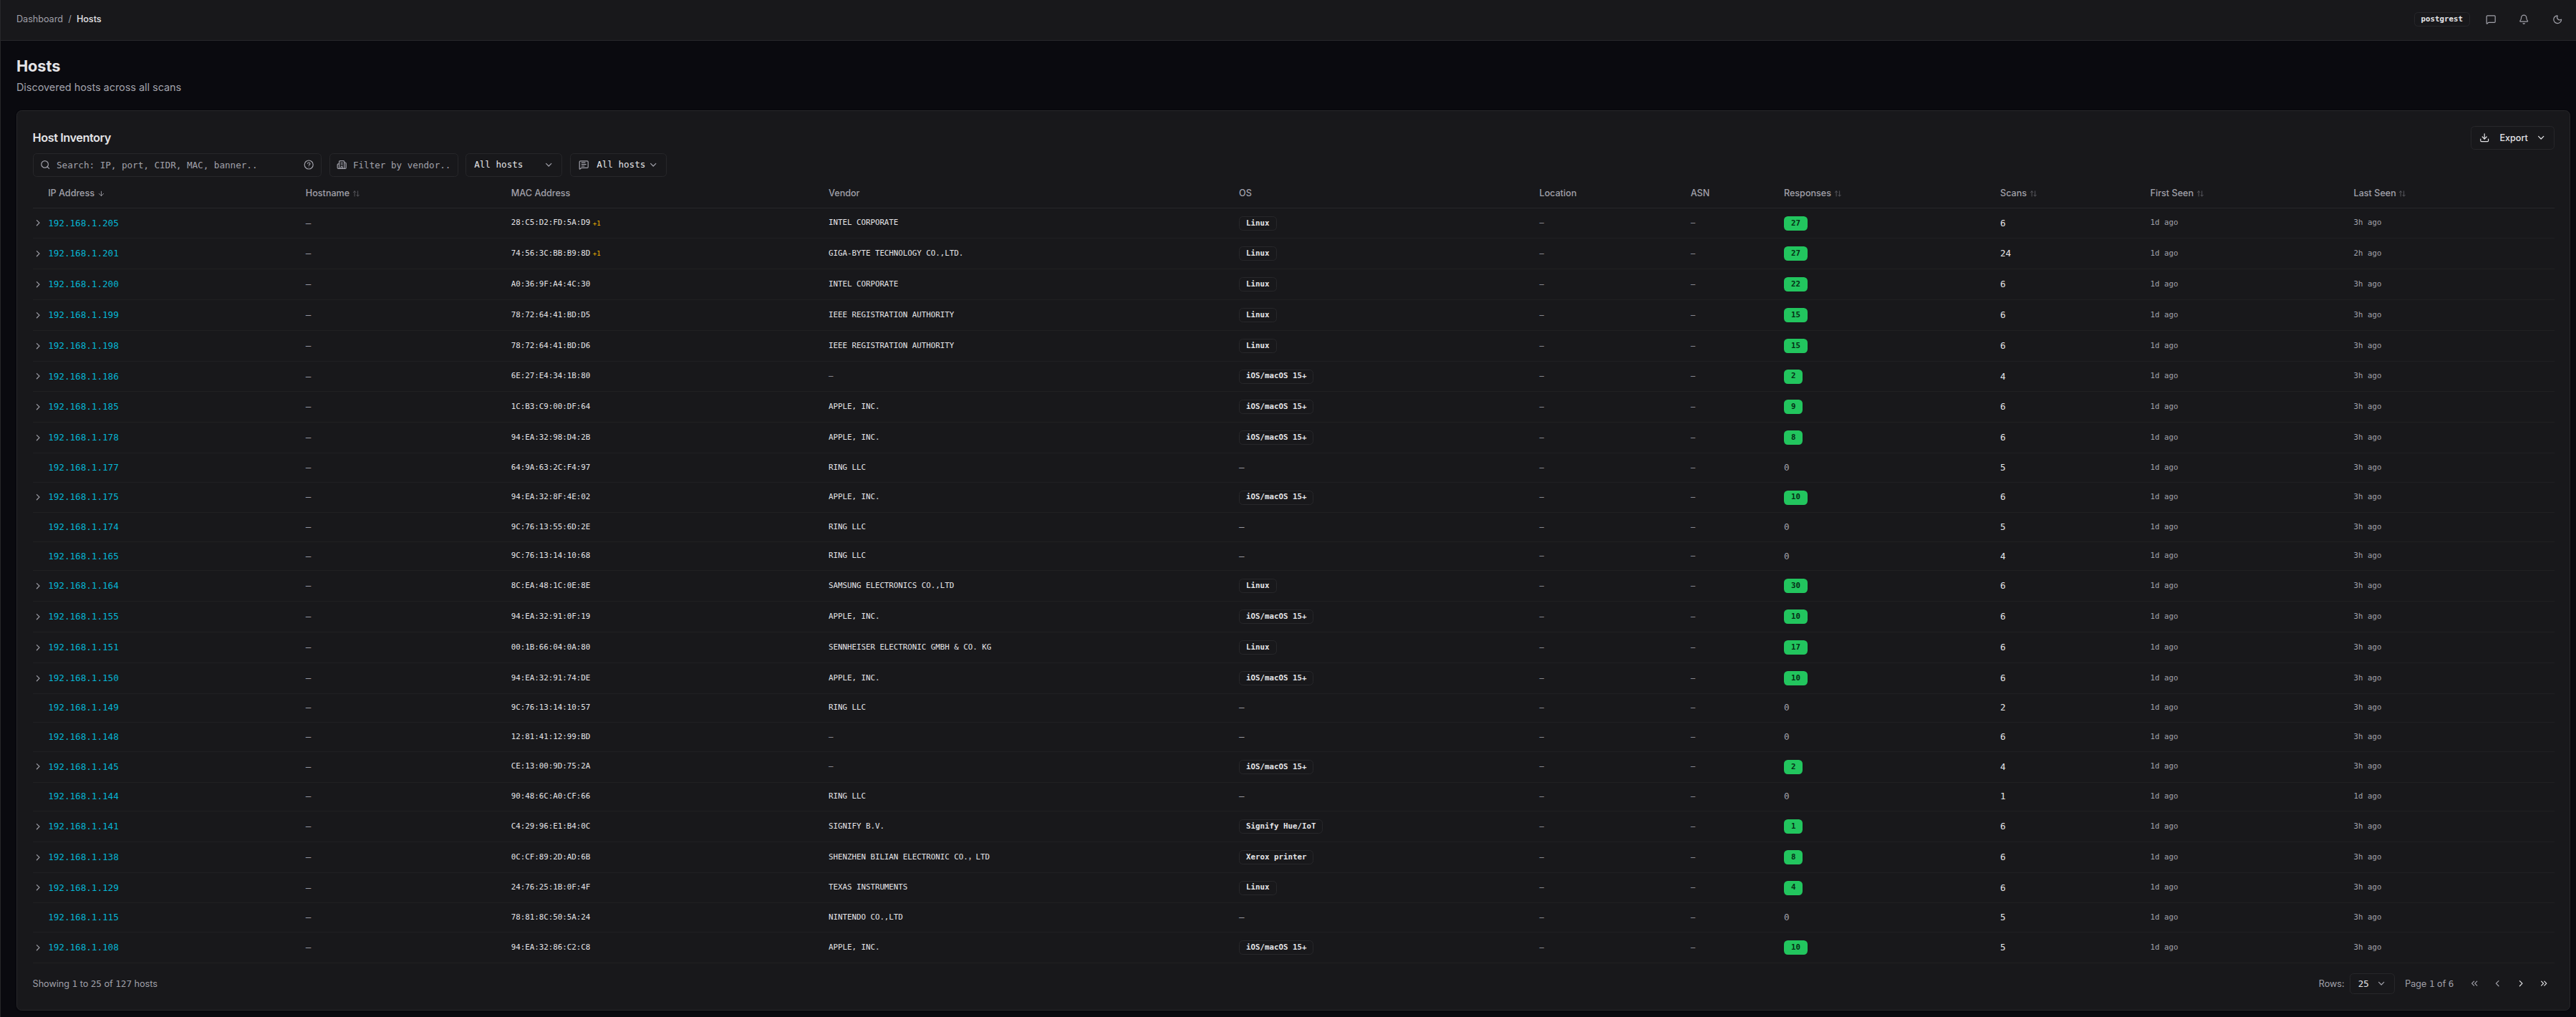 Click to enlargeHosts list page
5.1 Host Inventory Overview
The host table shows:
- ▸IP Address - Click to view host details
- ▸Hostname - Reverse DNS name (if available)
- ▸Ports - Number of distinct ports observed
- ▸Scans - Number of scans that found this host
- ▸First Seen - When the host was first discovered
- ▸Last Seen - Most recent observation
5.2 Searching and Filtering
The search bar supports multiple query types:
- ▸IP address -
192.168.1.50 - ▸CIDR range -
192.168.1.0/24 - ▸Port number -
port:22orport:80,443 - ▸Service name -
service:httporservice:ssh - ▸Combined -
192.168.1.0/24 port:22
5.3 Host Detail Page
Click any host to view its complete profile:
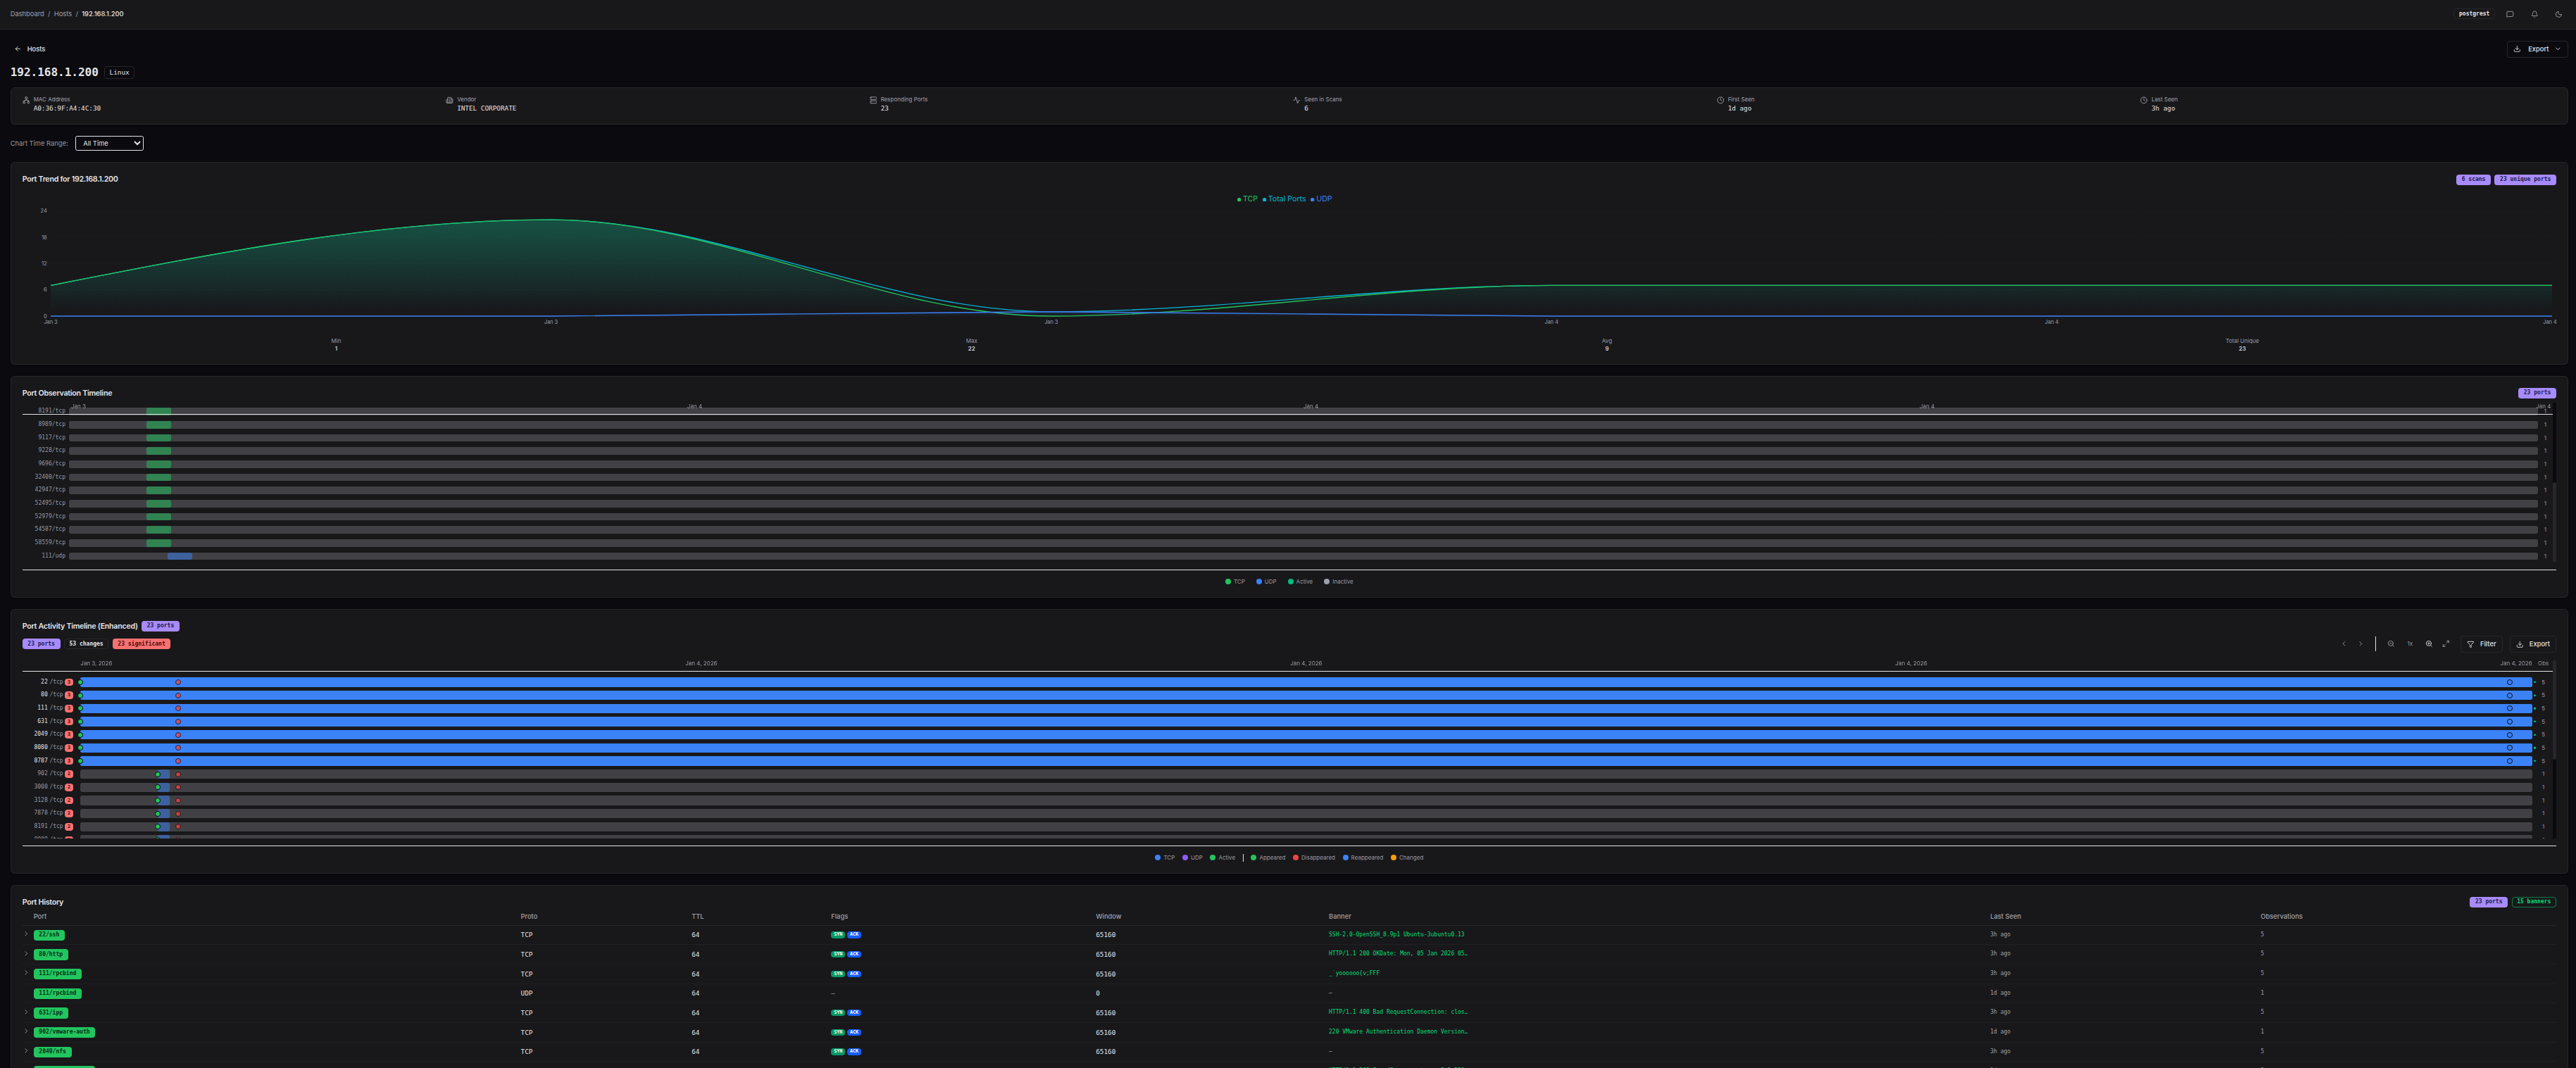 Click to enlargeHost detail page
The host detail page consolidates everything known about a host in one place:
Port Trend Chart
Visualizes how many ports were open over time:
 Click to enlargePort trend chart
Port Timeline
Shows the lifespan of each port - when it was first and last seen:
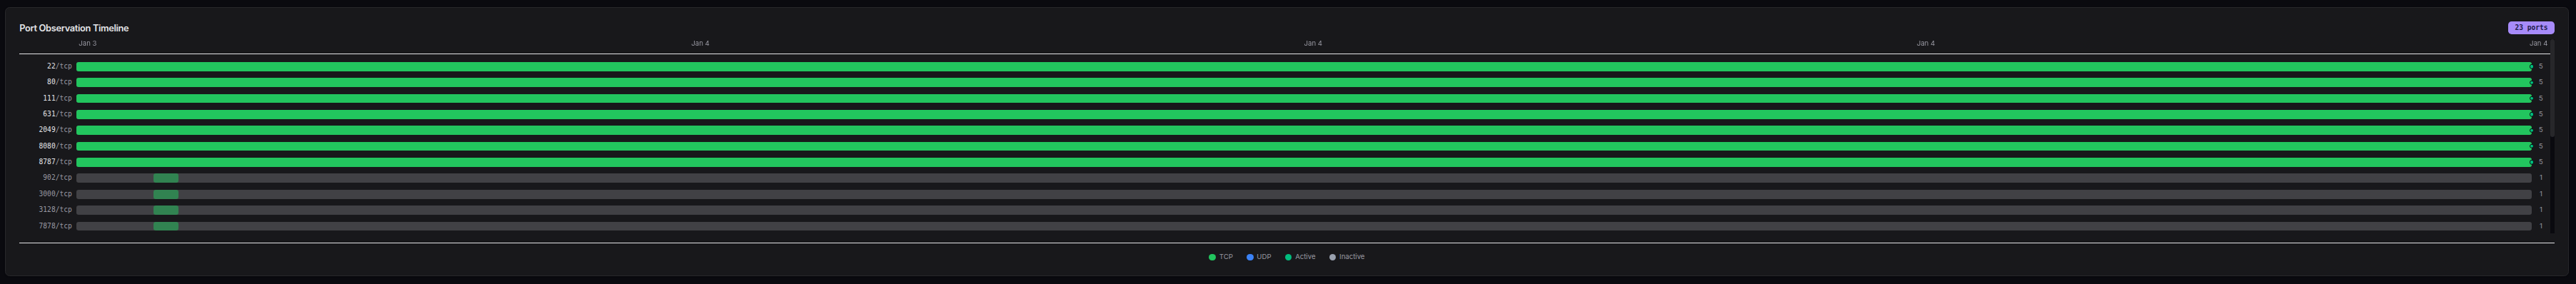 Click to enlargePort timeline
Enhanced Host Timeline
An interactive timeline with:
- ▸Change detection highlighting
- ▸Zoom and pan controls
- ▸Filtering by port or service
- ▸Export capability
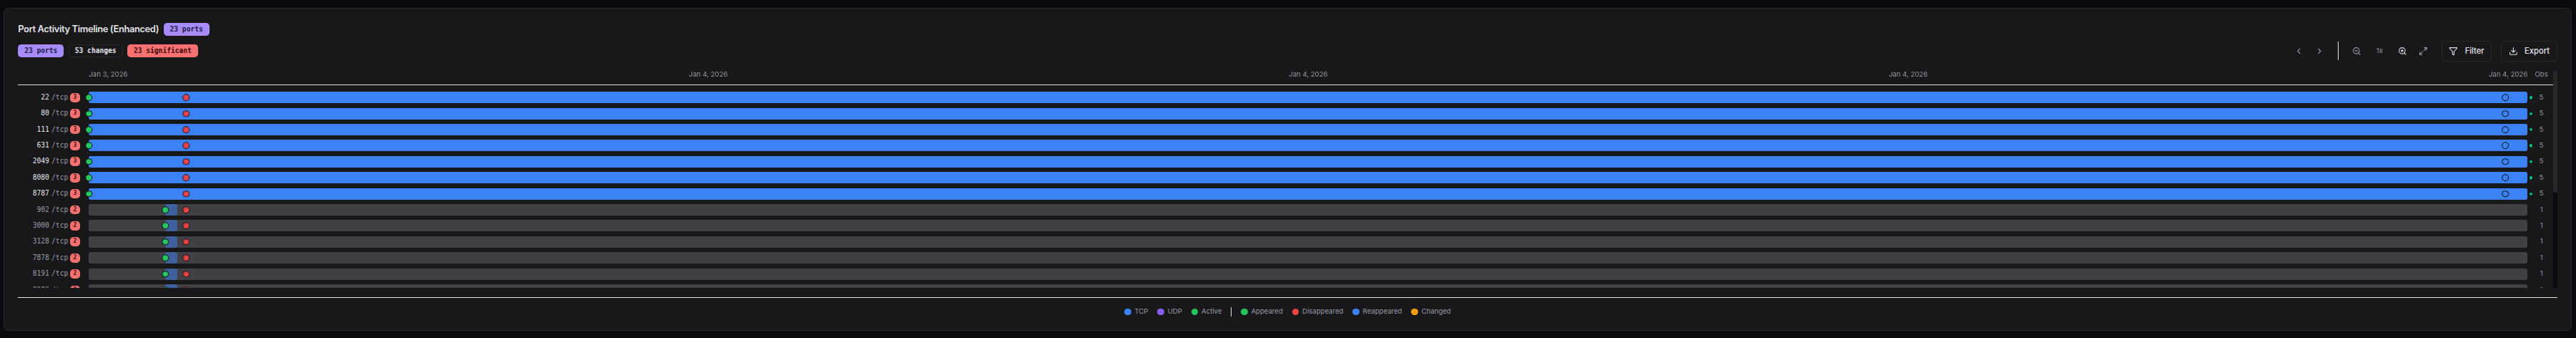 Click to enlargeEnhanced host timeline
Port History
A detailed table of every port observation:
- ▸Port number and protocol
- ▸Service name
- ▸TCP flags
- ▸TTL value
- ▸Observation timestamp
Associated Scans
List of all scans that discovered this host, with quick links to each scan's detail page.
Notes
Add annotations about this host that persist across sessions.
6. Topology
The Topology page provides a network graph visualization of your scan data.
 Click to enlargeTopology page
6.1 Global vs Scan-Specific View
- ▸Global view (
/topology) - Shows all hosts across all scans - ▸Scan-specific view (
/topology?scan_id=123) - Shows only hosts from one scan
Access scan-specific topology from any scan's detail page.
6.2 Graph Interaction
- ▸Click a node to see its details in the sidebar
- ▸Drag nodes to rearrange the layout
- ▸Scroll to zoom in/out
- ▸Pan by dragging the background
6.3 Node Types
The graph uses different colors for node types:
- ▸Red - Scanner (your scanning host)
- ▸Amber - Router (identified via TTL analysis)
- ▸Green - Host (discovered target)
6.4 Selected Node Details
When you click a node, the sidebar shows:
- ▸IP address and hostname
- ▸Node type (scanner, router, host)
- ▸OS detection guess (if available)
- ▸Port count and connection count
- ▸TTL and estimated hops
- ▸First/last seen timestamps
- ▸Link to host detail page
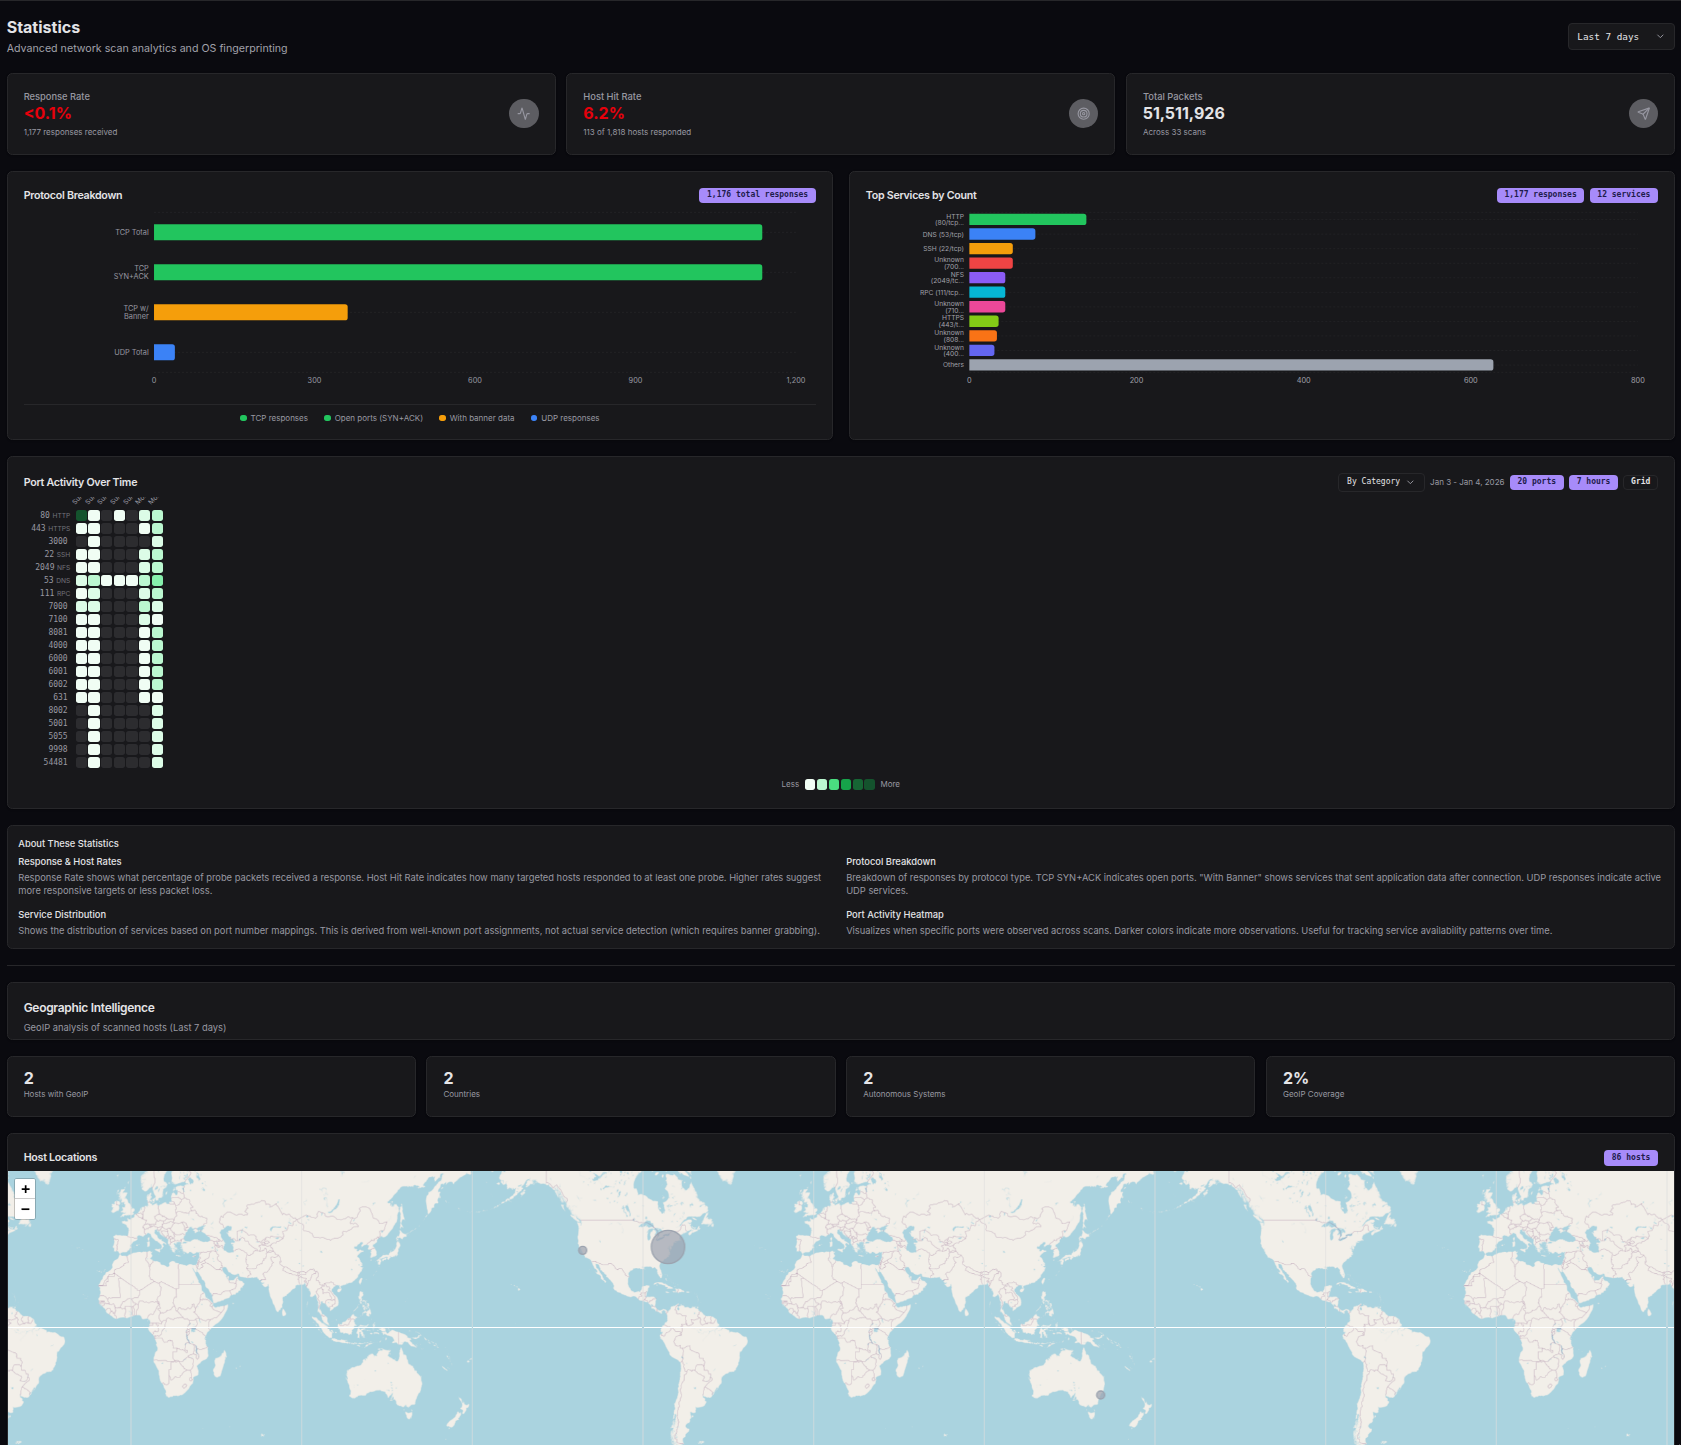
7. Statistics
The Statistics page provides advanced analytics and visualizations.
 Click to enlargeStatistics page
7.1 Scan Performance Stats
Cards showing aggregate metrics:
- ▸Response Rate - Percentage of probes that received responses
- ▸Host Hit Rate - Percentage of targeted hosts that responded
- ▸Average Ports/Host - Mean ports discovered per host
7.2 Protocol Breakdown
Pie/bar charts showing distribution of:
- ▸TCP SYN+ACK (open ports)
- ▸TCP RST (closed ports)
- ▸TCP with Banner (services that sent data)
- ▸UDP responses
7.3 Service Distribution
Bar chart of the most commonly discovered services based on port number mappings.
7.4 Port Activity Heatmap
A time-based heatmap showing when specific ports were observed:
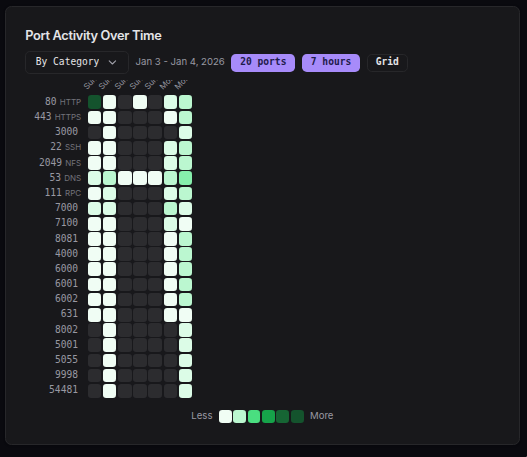 Click to enlargePort activity heatmap
- ▸X-axis: Time
- ▸Y-axis: Port numbers
- ▸Color intensity: Number of observations
Useful for spotting patterns like services that only run during business hours.
7.5 GeoIP Section
If you've scanned external IP addresses, the GeoIP section shows:
- ▸World Map - Geographic distribution of targets
- ▸Country Table - Breakdown by country
- ▸ASN Table - Breakdown by autonomous system
- ▸IP Type Chart - Distribution of IP types (residential, datacenter, etc.)
8. Settings
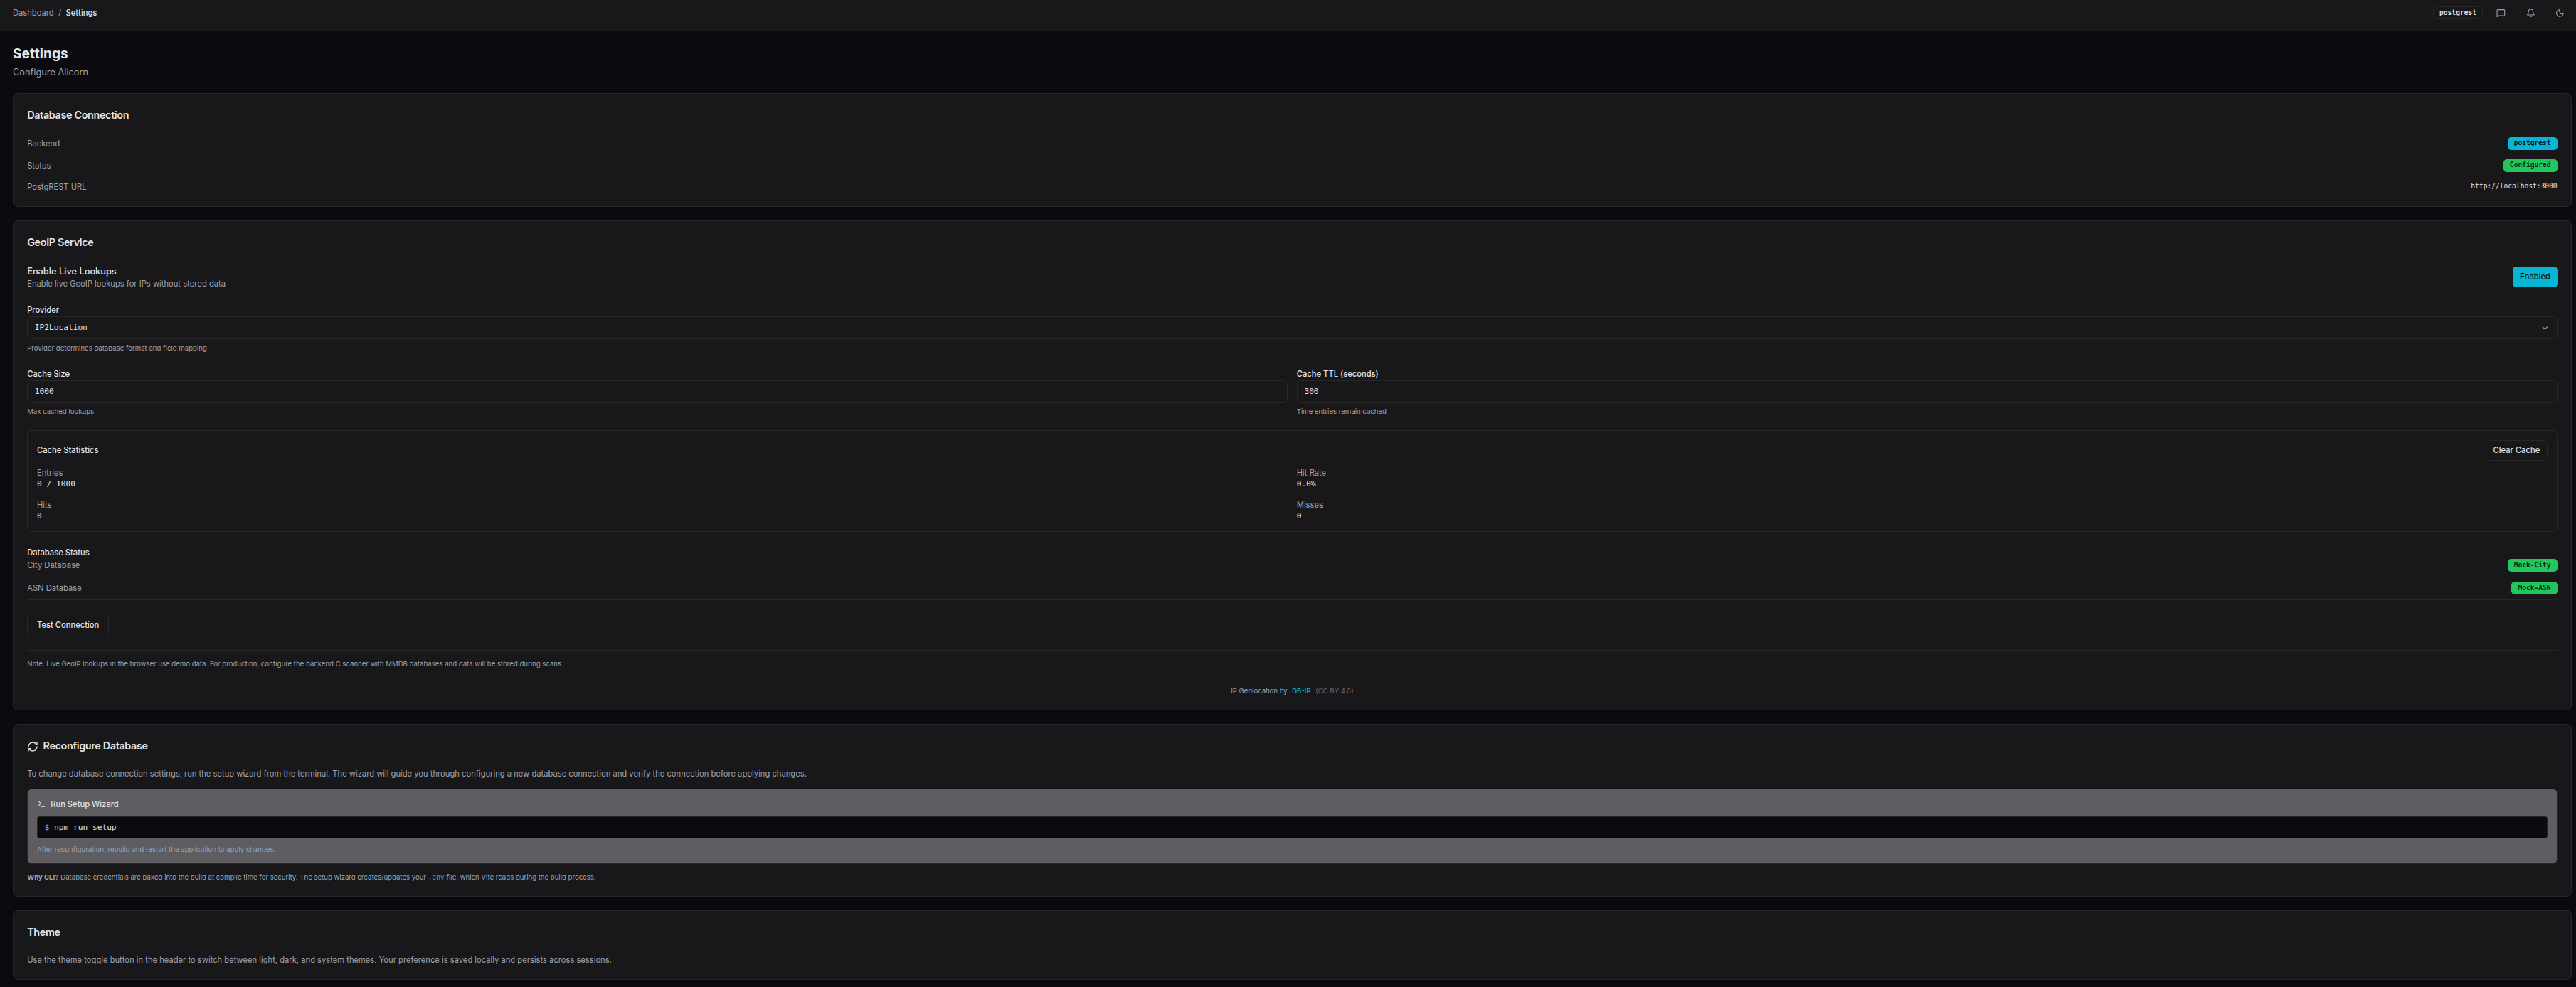
The Settings page allows you to configure Alicorn's behavior.
 Click to enlargeSettings page
8.1 Database Connection
Displays the current database connection status:
- ▸Backend - Always "postgrest"
- ▸Status - Configured or Not Configured
- ▸PostgREST URL - The API endpoint being used
8.2 GeoIP Service
Configure live GeoIP lookups for IP addresses:
- ▸Enable Live Lookups - Toggle live GeoIP resolution
- ▸Provider - Select your MMDB provider:
- ▸MaxMind GeoIP2/GeoLite2
- ▸IPinfo (MMDB format)
- ▸IP2Location
- ▸Cache Size - Maximum number of cached lookups
- ▸Cache TTL - How long entries remain cached (seconds)
The cache statistics panel shows hit rate and usage.
Note: Live GeoIP lookups in the browser use demo data. For production use, configure the backend scanner with MMDB databases and GeoIP data will be stored during scans.
8.3 Reconfiguring the Database
To change database connection settings, use the CLI wizard:
npm run setup
The wizard guides you through configuring a new database connection. After reconfiguration, rebuild and restart the application.
8.4 Theme
Use the theme toggle button in the header (sun/moon icon) to switch between:
- ▸Light - Light background, dark text
- ▸Dark - Dark background, light text (default)
- ▸System - Follows your OS preference
Your preference is saved locally and persists across sessions.
Quick Reference
Keyboard Shortcuts
| Shortcut | Action |
|---|---|
/ | Focus search (on list pages) |
Esc | Clear selection / Close modal |
URL Patterns
| URL | Purpose |
|---|---|
/ | Dashboard |
/scans | Scan list |
/scans/:id | Scan detail |
/scans/compare?ids=1,2,3 | Compare scans 1, 2, and 3 |
/hosts | Host list |
/hosts/:ip | Host detail by IP |
/topology | Global topology |
/topology?scan_id=123 | Topology for scan 123 |
/statistics | Statistics page |
/settings | Settings page |
Export Formats
| Format | Best For |
|---|---|
| CSV | Spreadsheets, data analysis |
| JSON | Programmatic processing, APIs |
| Markdown | Documentation, reports, wikis |